Intro

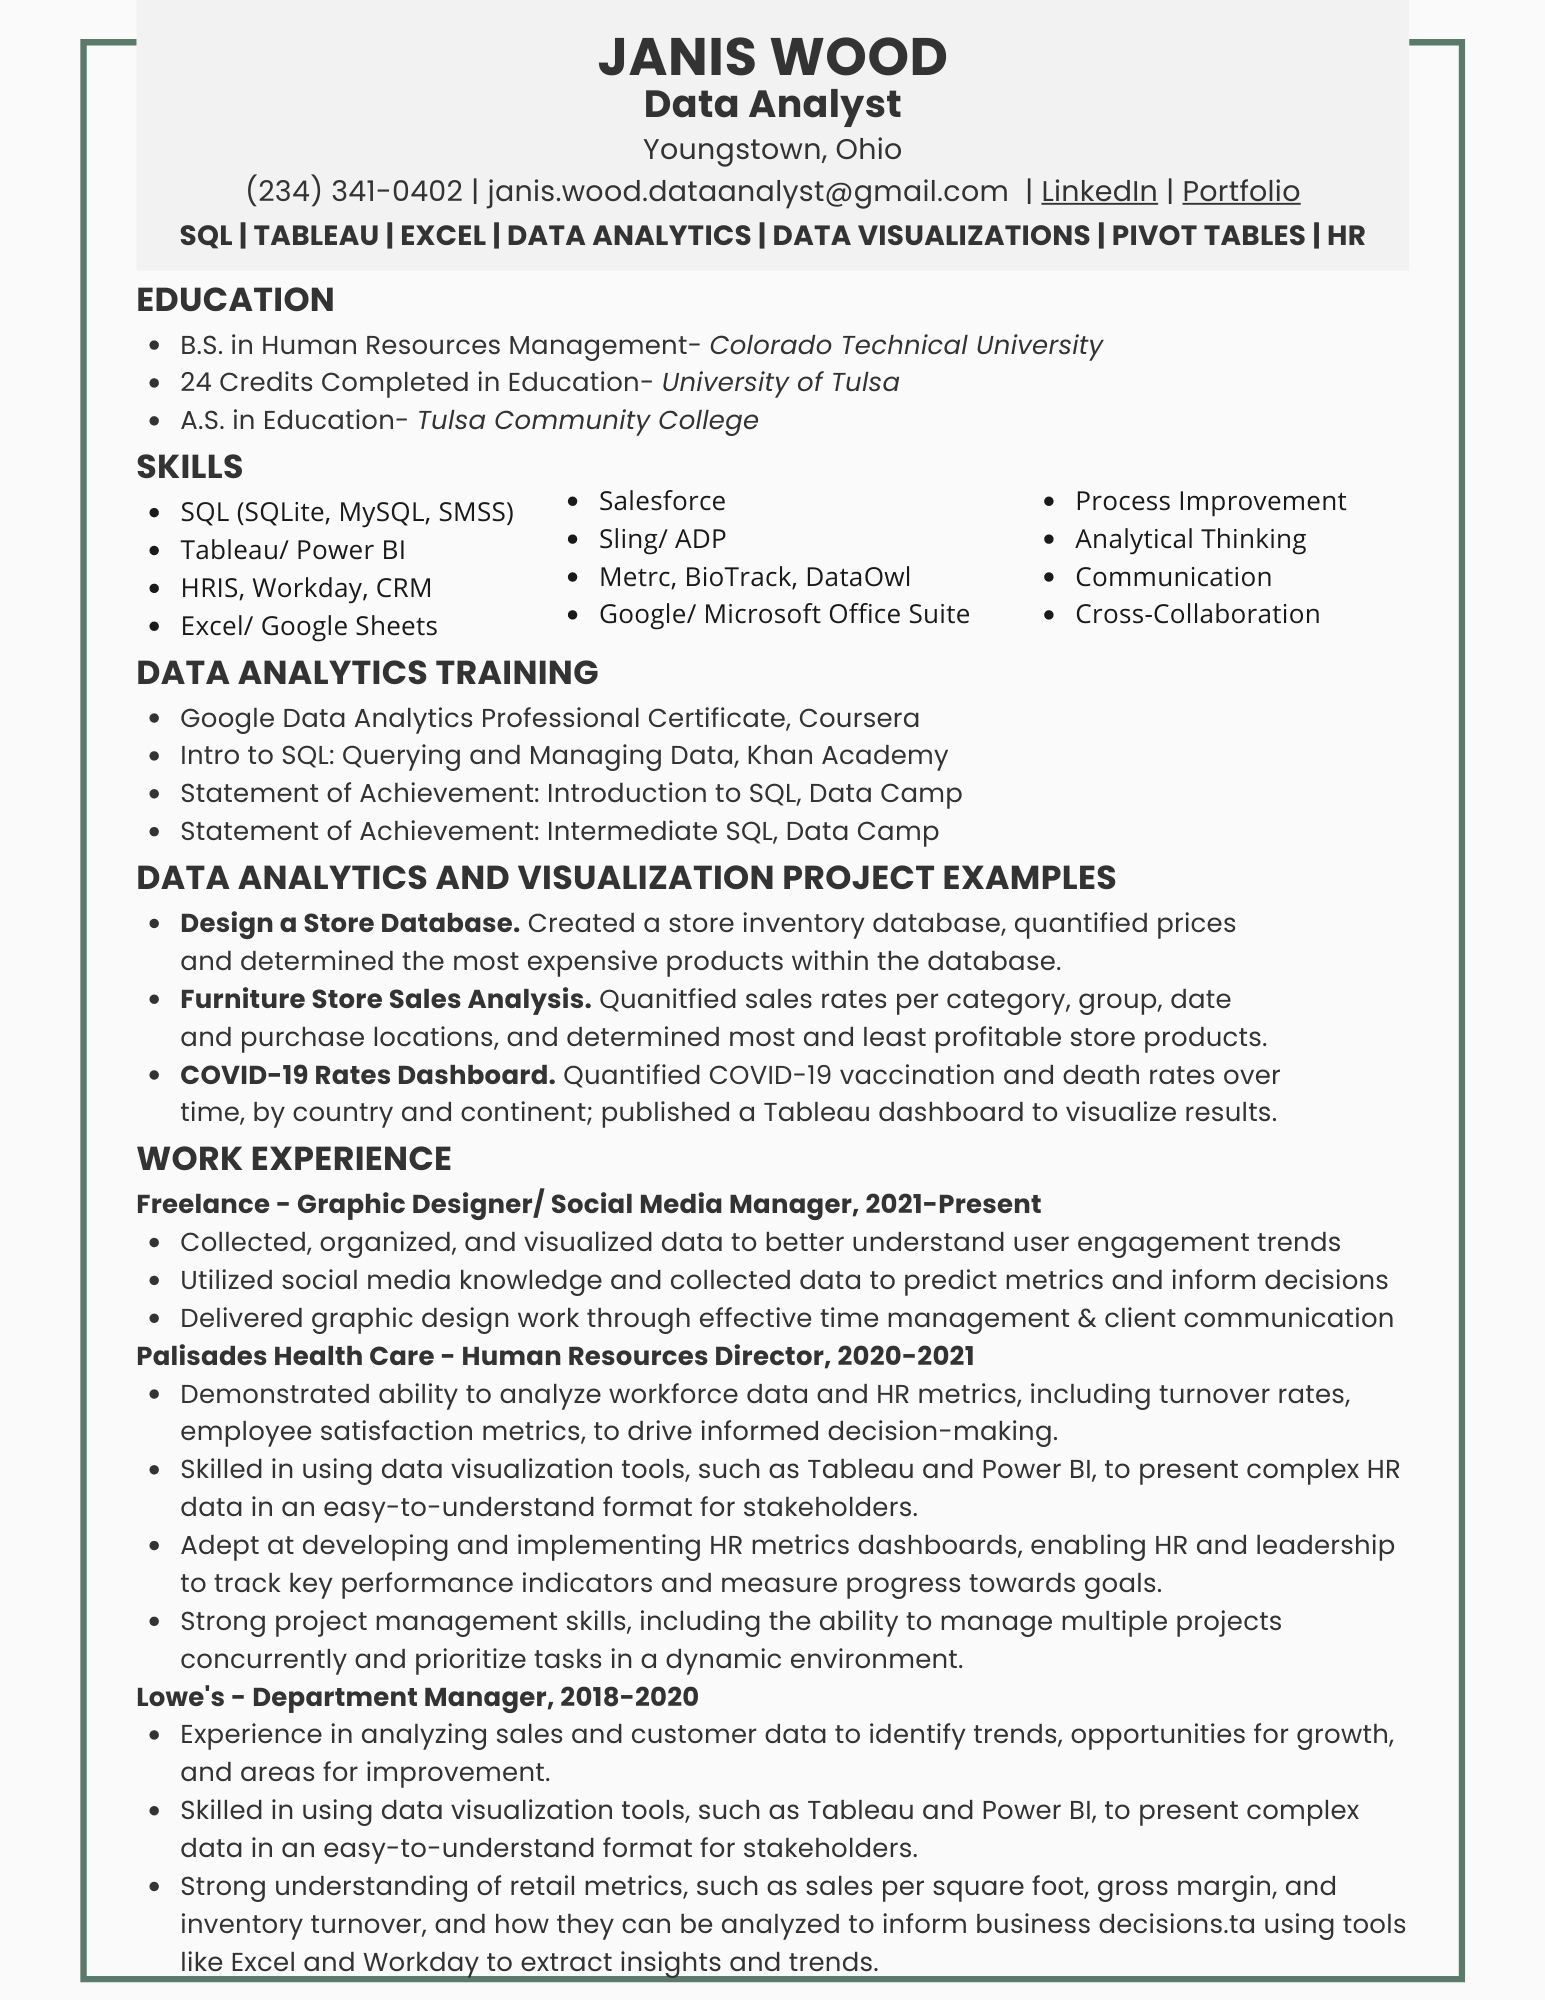
My name is Janis Wood and as a Human Resources professional and trained Data Analyst based in Youngstown, Ohio, I am passionate about breaking into the analytics field. My other passions include solo-hiking, camping, thrift store treasure hunting and good old fashioned road trips.
With experience in HR and data analysis, I have developed a keen eye for detail, a strong ability to analyze complex information, and an unwavering commitment to accuracy.
I am seeking a full-time remote position that will allow me to apply my skills and knowledge to drive business growth and success.
With a strong work ethic, exceptional communication skills, and a proven track record of delivering high-quality results, I am confident that I can make a valuable contribution to any organization.
Projects

On this page you will find projects that I have created to display my current skill set. Earlier projects during my tenure as a Retail Department Manager and Human Resources Director were proprietary and as such are not available for display.
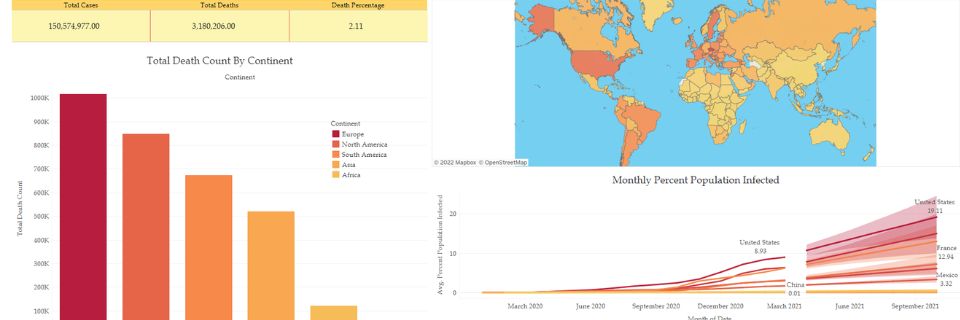
Covid Tableau Project
In this project I utilized Tableau Public to create a dashboard on global Covid-19 data. I used the data from my previous Covid Data Exploration project to compile a dashboard detailing global infection and death rates.
 Covid Data Exploration
In this project I used SQL Server to explore global COVID-19 data. I used a data set from Our World in Data and processed it through Google Sheets for cleaning and applying formulas.
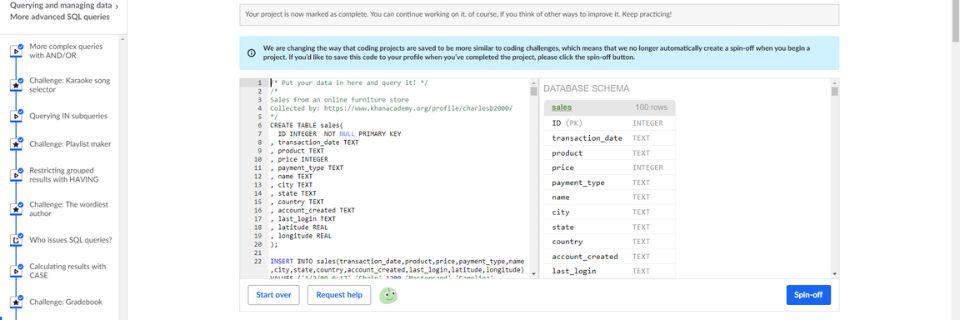
 Khan Academy Data Dig
While taking Khan Academy's Intro to SQL course we were asked to create a table from a list of provided data sets. After creating that table we were tasked with making a series of queries to dig deeper into the data and formulate ideas about how to apply the results to a potential retail store.
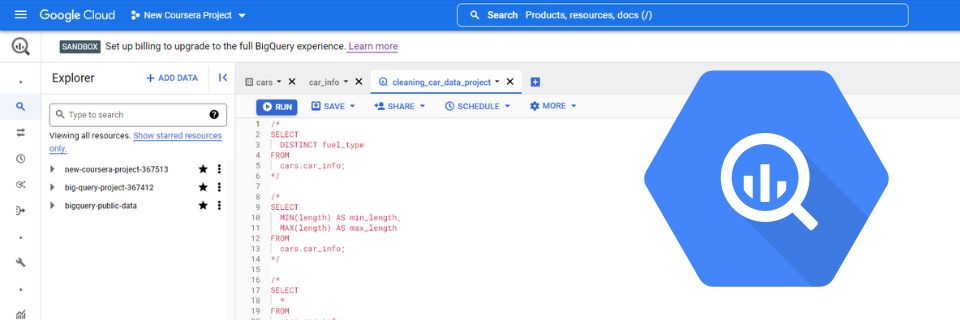
 Coursera Google Data Cleaning
One of the many projects included in the Google Data Analytics Certificate Course from Coursera was utilizing advanced data cleaning techniques to produce a polished dataset. I selected a dirty dataset about car sales and ran it through BigQuery to analyze and clean the data. To transfer the data to GitHub for presentation I used the Goliath/ Potens extension tool.
Resume


Contact
 Linkedin
GitHub
Tableau
Elements
Text
This is bold and this is strong. This is italic and this is emphasized.
This is superscript text and this is subscript text.
This is underlined and this is code: for (;;) { ... }. Finally, this is a link.
Heading Level 2
Heading Level 3
Heading Level 4
Heading Level 5
Heading Level 6
Blockquote
Fringilla nisl. Donec accumsan interdum nisi, quis tincidunt felis sagittis eget tempus euismod. Vestibulum ante ipsum primis in faucibus vestibulum. Blandit adipiscing eu felis iaculis volutpat ac adipiscing accumsan faucibus. Vestibulum ante ipsum primis in faucibus lorem ipsum dolor sit amet nullam adipiscing eu felis.
Preformatted
i = 0;

while (!deck.isInOrder()) {
    print 'Iteration ' + i;
    deck.shuffle();
    i++;
}

print 'It took ' + i + ' iterations to sort the deck.';
Lists
Unordered
- Dolor pulvinar etiam.
- Sagittis adipiscing.
- Felis enim feugiat.
Alternate
- Dolor pulvinar etiam.
- Sagittis adipiscing.
- Felis enim feugiat.
Ordered
- Dolor pulvinar etiam.
- Etiam vel felis viverra.
- Felis enim feugiat.
- Dolor pulvinar etiam.
- Etiam vel felis lorem.
- Felis enim et feugiat.
Icons
Actions
Table
Default
| Name |
Description |
Price |
| Item One |
Ante turpis integer aliquet porttitor. |
29.99 |
| Item Two |
Vis ac commodo adipiscing arcu aliquet. |
19.99 |
| Item Three |
Morbi faucibus arcu accumsan lorem. |
29.99 |
| Item Four |
Vitae integer tempus condimentum. |
19.99 |
| Item Five |
Ante turpis integer aliquet porttitor. |
29.99 |
|
100.00 |
Alternate
| Name |
Description |
Price |
| Item One |
Ante turpis integer aliquet porttitor. |
29.99 |
| Item Two |
Vis ac commodo adipiscing arcu aliquet. |
19.99 |
| Item Three |
Morbi faucibus arcu accumsan lorem. |
29.99 |
| Item Four |
Vitae integer tempus condimentum. |
19.99 |
| Item Five |
Ante turpis integer aliquet porttitor. |
29.99 |
|
100.00 |